Quick hint how to trace lambda functions in Lumigo
General
Monitoring Serverless applications can be tough. The Serverless ecosystem itself is very fresh, hence there is still a huge area for improvement. Existing cloud services are not the best in terms of monitoring Serverless applications. If you have a very Lambda-heavy architecture at hand that needs proper monitoring, you need in a much cleaner way than AWS CloudWatch provides.
Fortunately, third-party companies on the market already offer ready-made solutions that streamline and simplify the work of monitoring Serverless applications.
From my own experience, I only have experience with Lumigo and Datadog, and for beginners and small projects that are just starting out Serverless Lumigo is ideal - a very clear tool, as well as easy to do everything in it.
As for Datadog, a very powerful tool, but for small teams it can be too time-consuming to grasp. But remember - this is just my opinion.
Many people may wonder why use such tools when there is AWS Cloudwatch. Cloudwatch isn't ideal for viewing a lot of logs, sometimes we'd like us to see the flow of what's going on in an application, and have resources, costs, and other relevant things visualised, to make it as easy as possible to read information from the logs, and to debug and fix bugs from our applications as quickly as possible.
These tools do a log ingestion from Cloudwatch to themselves and then visualise this data for us. However, if AWS Cloudwatch doesn't have the data, or there's some kind of outage, these tools won't help us - it's all based on incoming data.
Back to Lumigo. All you need to do is register, then link your AWS account to Allows Lumigo to gather the resources, metrics. You can add projects in Lumigo, so if you have each environment in a separate AWS account, you do the above step analogously for each new environment.
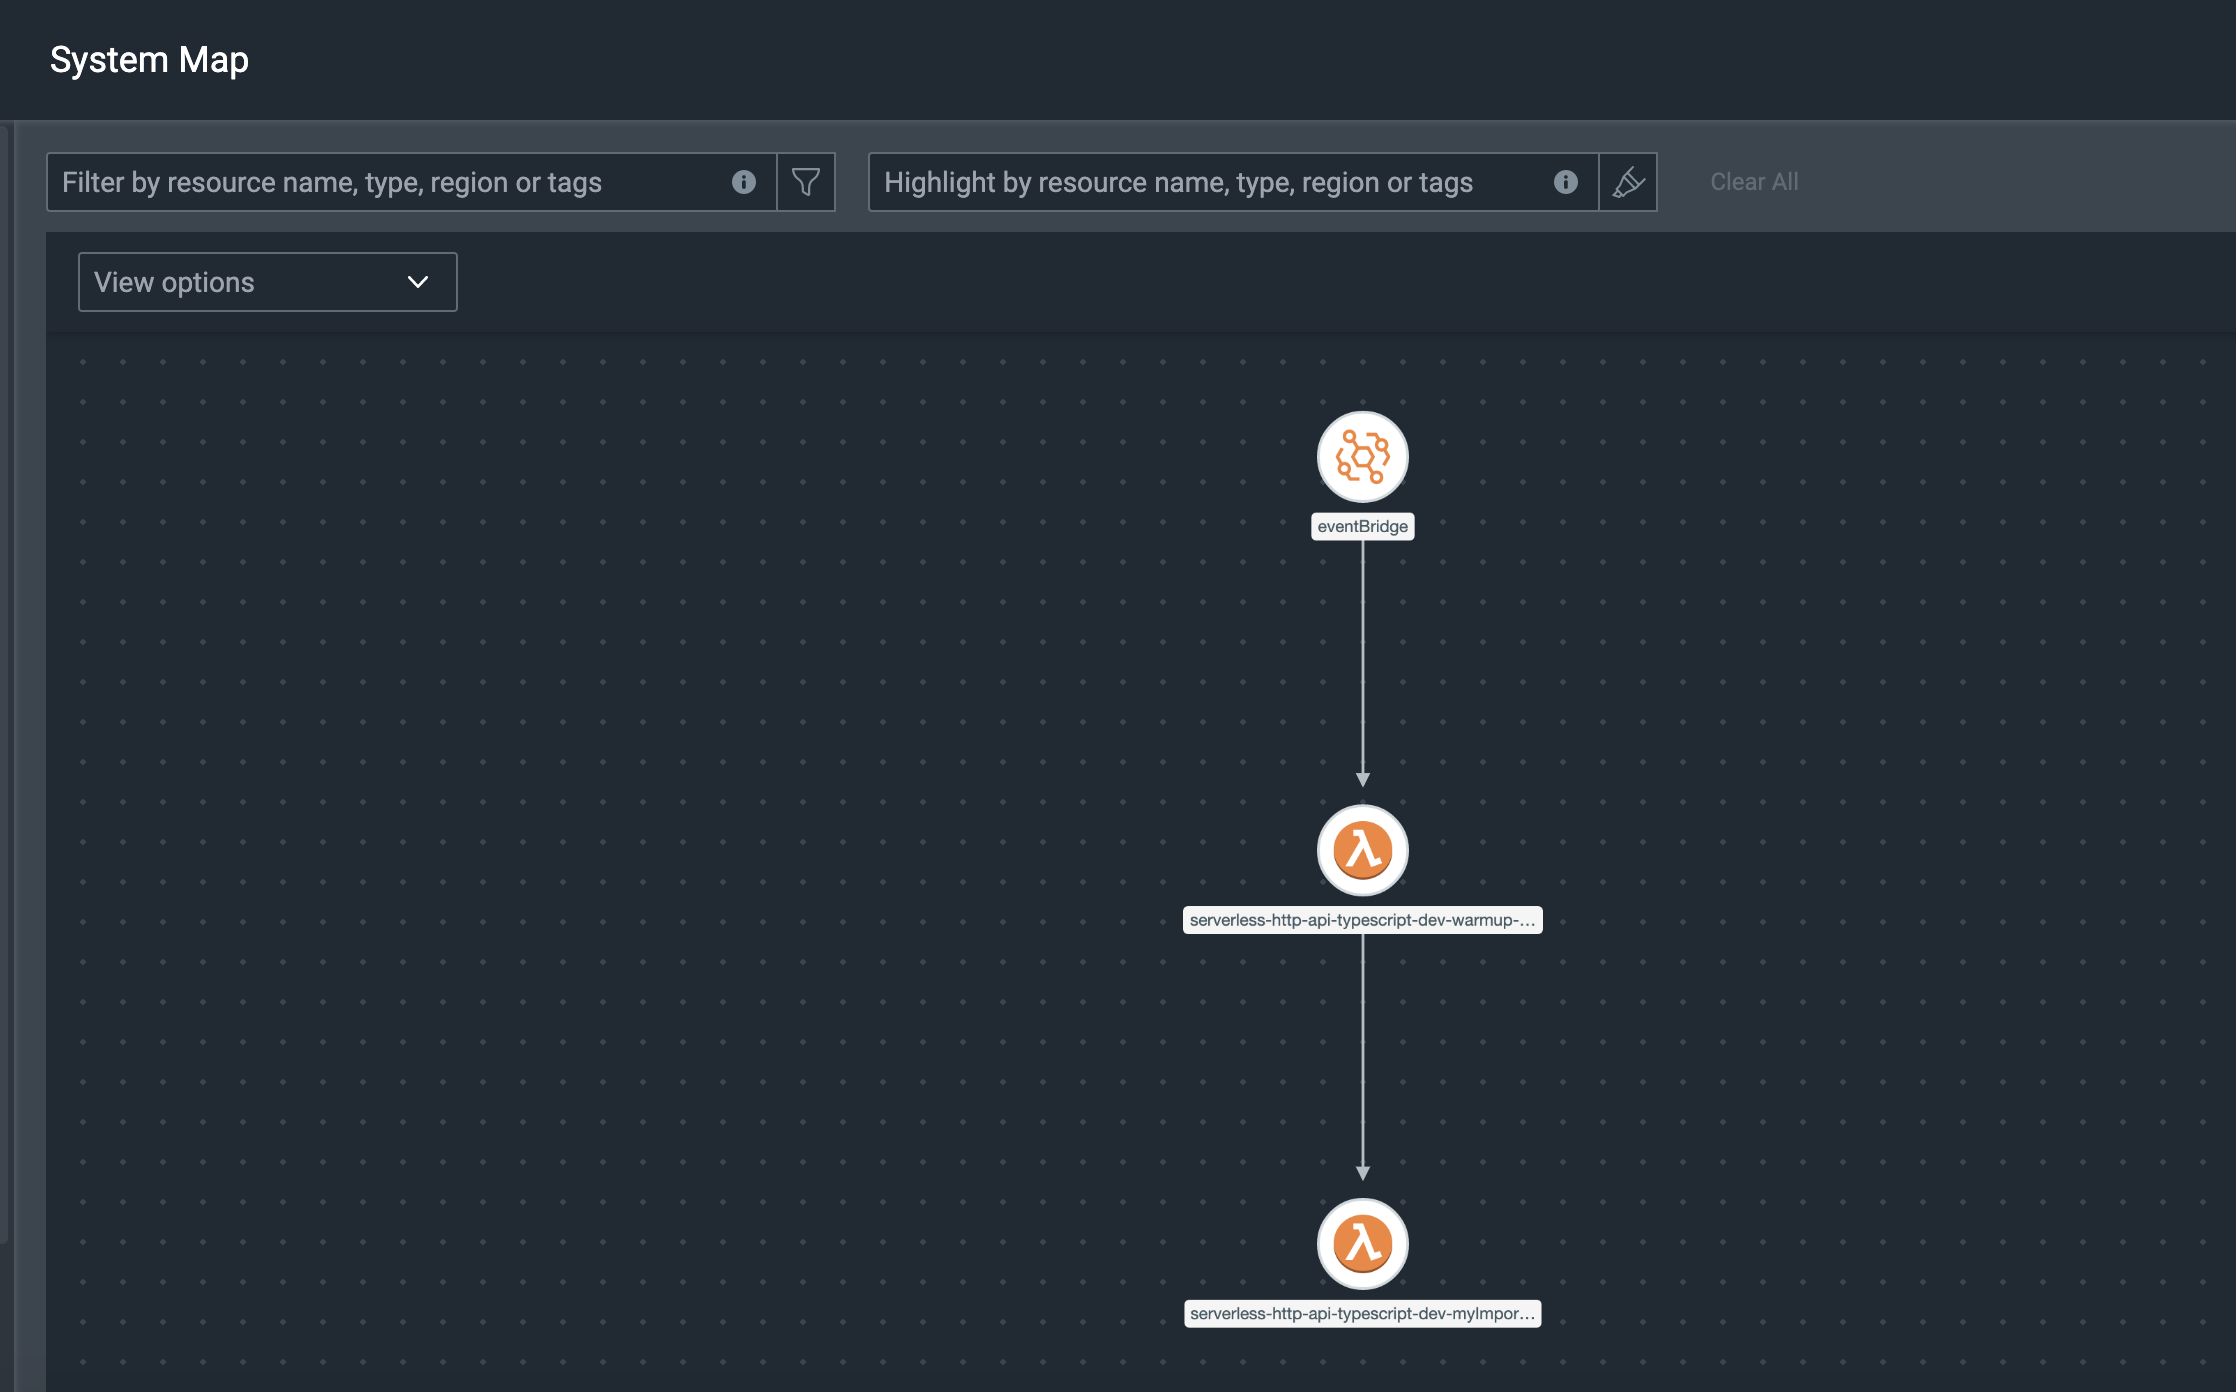
It's time to tackle trace AWS lambda functions, because that's mainly what we can do. Feel free to take a look at the documentation, it's very clear.
Tracing can be done in several ways:
- manually with lumigo_tracer package (check supported programming languages), but it requires a manual action on our side, making it not the best idea with many lambda functions, and working in a team.
- automatically, which is what developers like best. There are several ways to do this. However keep in mind that Auto-tracing is supported for Python and NodeJS Lambda functions runtime.
If we are talking about autotracing we have options:
- by using Lumigo lambda layer auto-tracing feature which automatically adds the Lumigo tracer to your functions.
- with the Lumigo UI, by selecting the functions you wish to trace.
- if you are using the Serverless Framework, there is a separate package from Lumigo for tracing - serverless-lumigo.
Which one to use? I often use the Serverless Framework, and in my opinion adding new packages are additional dependencies in the project that we wouldn't always want to have. Of the above, I wouldn't use any, because there is a simpler solution.
It is simpler to use stack tags from AWS for this. Inside the serverless.yml file in the provider section, add to tags a new tag - lumigo:auto-trace: true.
Then we have to do the project deployment and we are done. We need to wait some time for data propagation, about a few minutes or so and we're done.
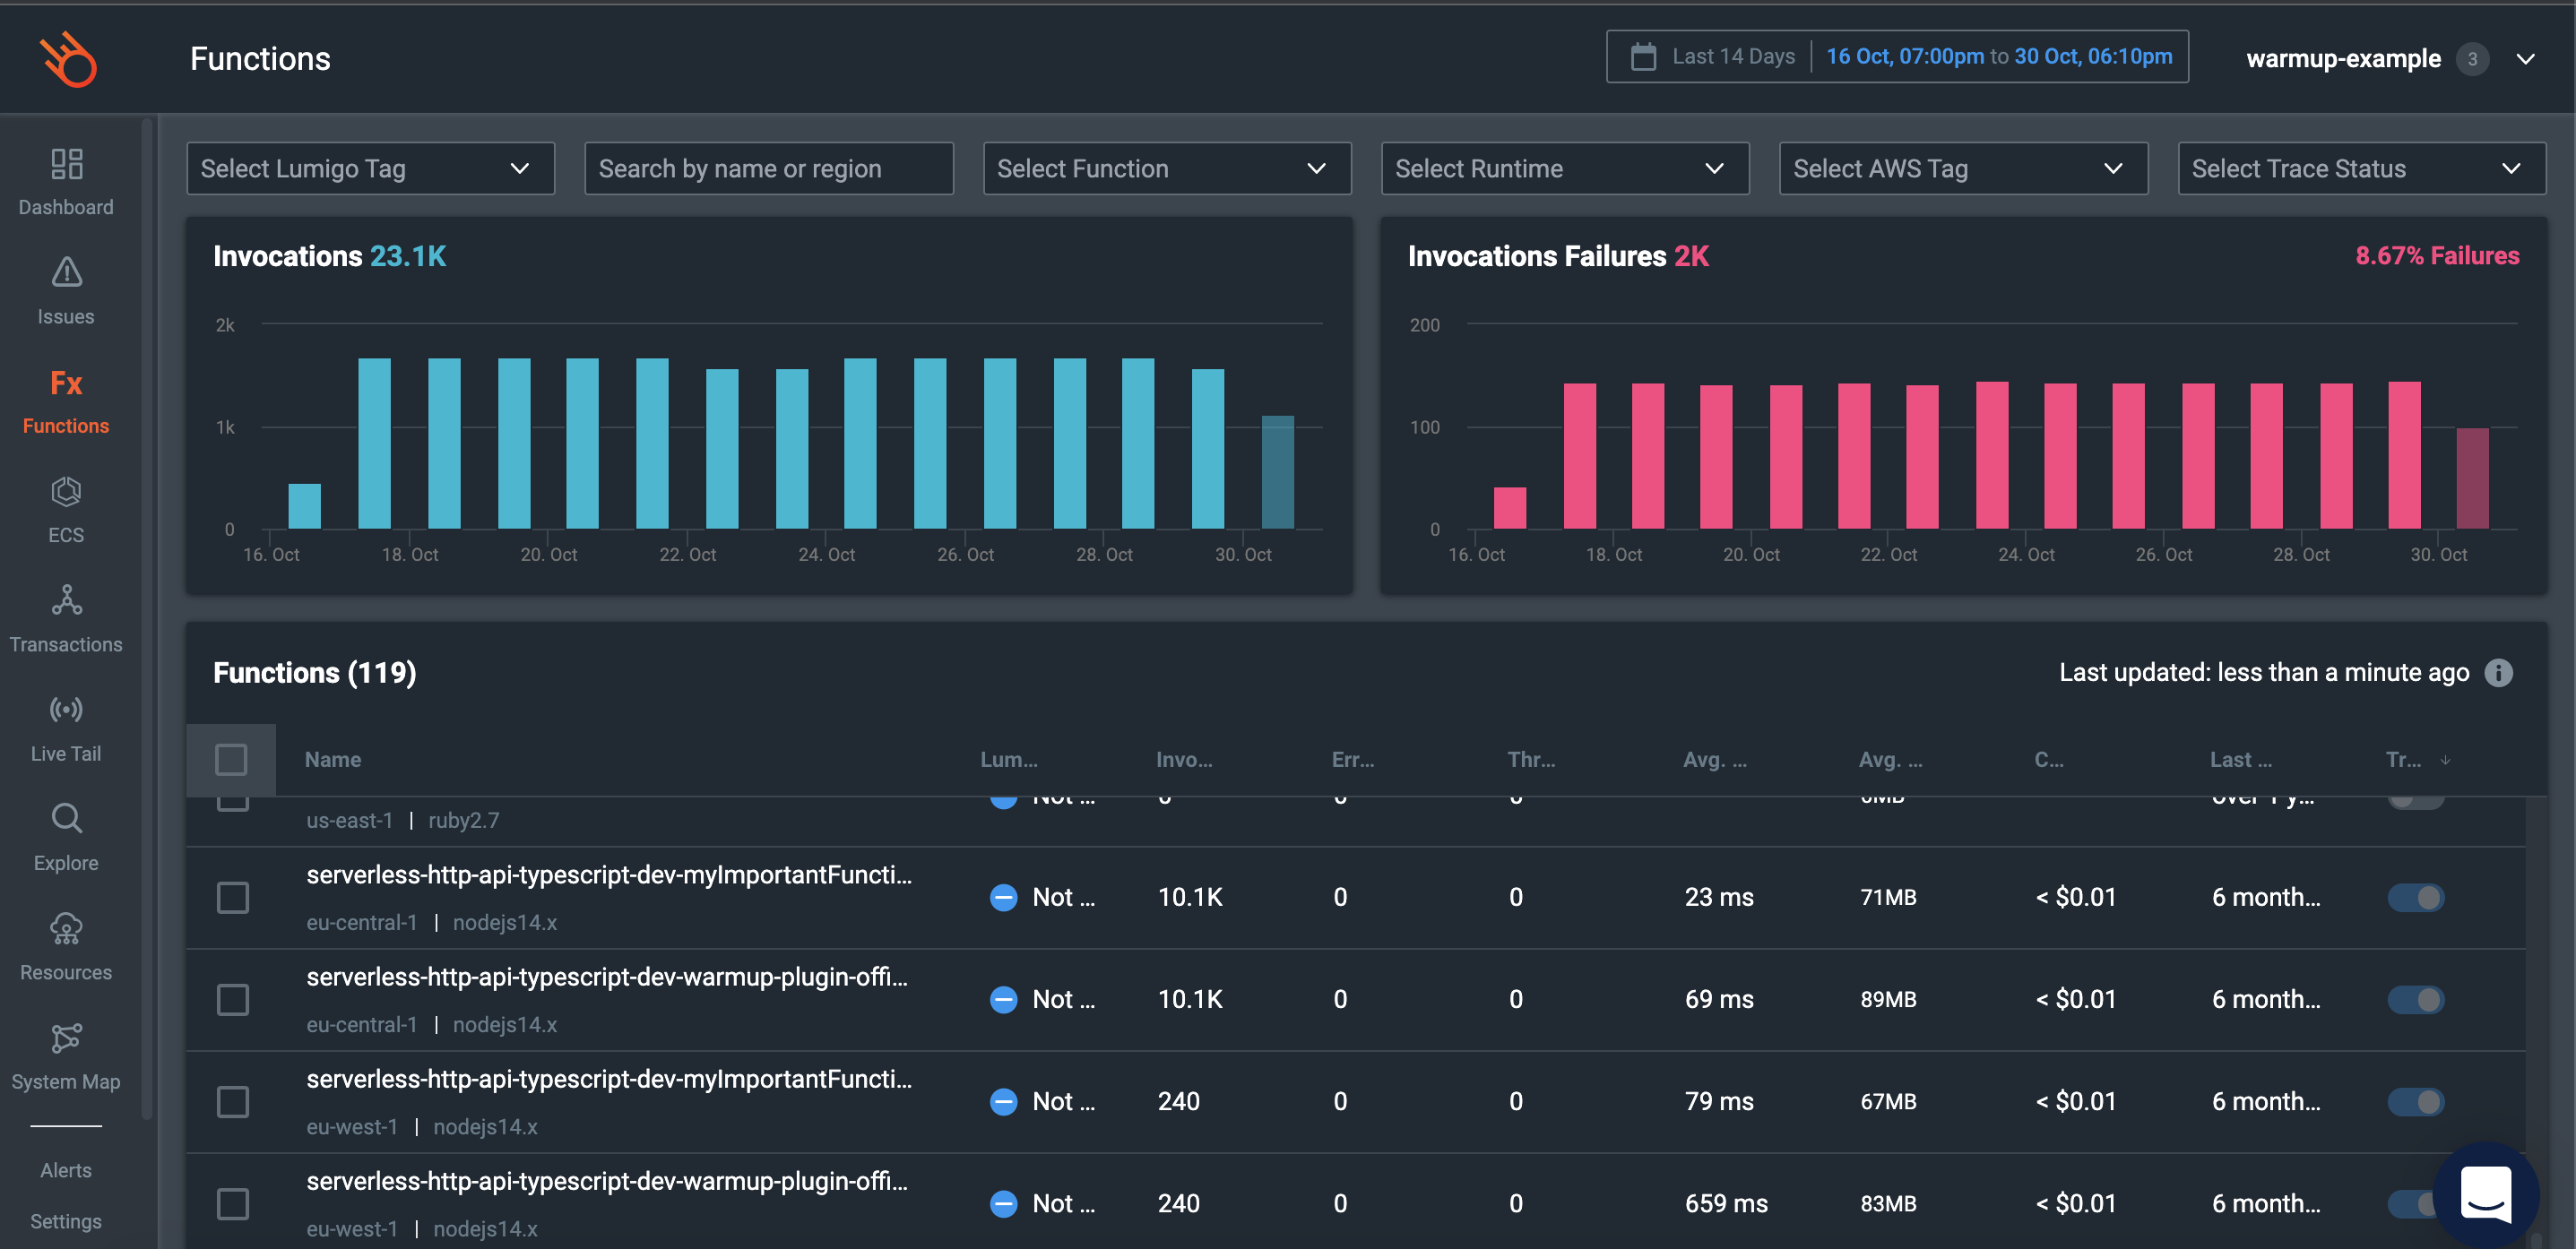
Then all we need to do is go into the dashboard, go into our functions and to the right of the function it should look like the image.
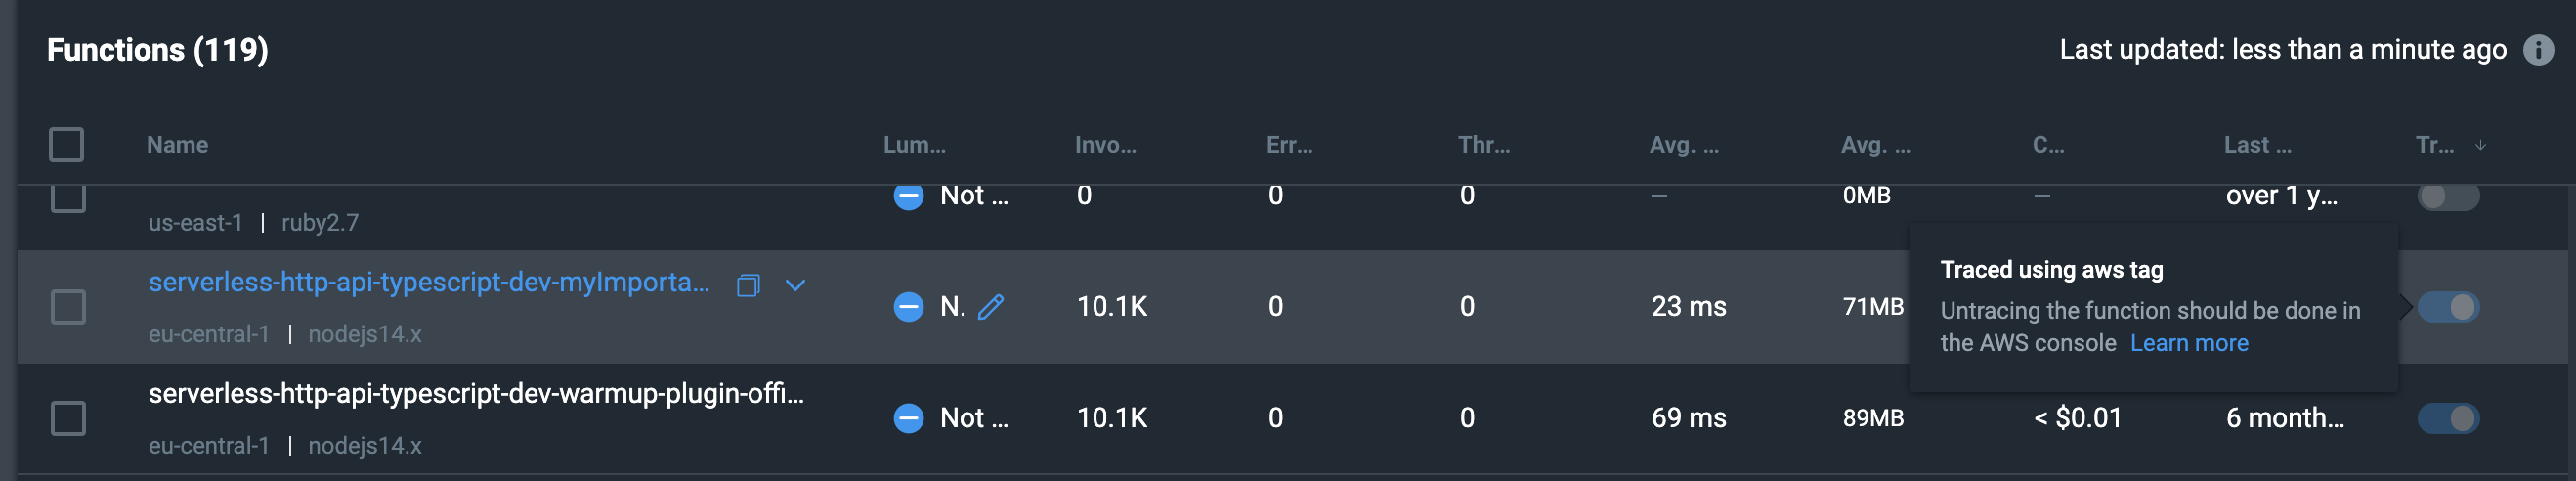
Problem solved with a simple tag, no additional libraries or extra code. We will now have an automatically generated tag for each new function.